Building scalable enterprise digital commerce for a global pharma giant
Digital transformation around the e-commerce services across multiple geographies and business divisions for a globally leading pharma company.
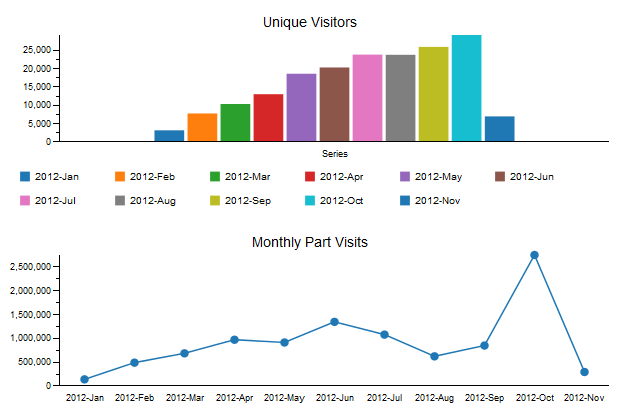
Monitor and analyze Apache web logs for web analytics. Use it to get your website more productive, detect any errors and fix them. The solution is built using Apache Hadoop platform. HIVE is used as an interface with Pentaho BI tool.
Pentaho ETL Job allow you to build MapReduce jobs with as much as 15x development productivity and runtime performance gains as compared to hand coded MapReduce. With this new solution and technology approach, original processing time of 1.5 days cuts down to 1.5 hrs.
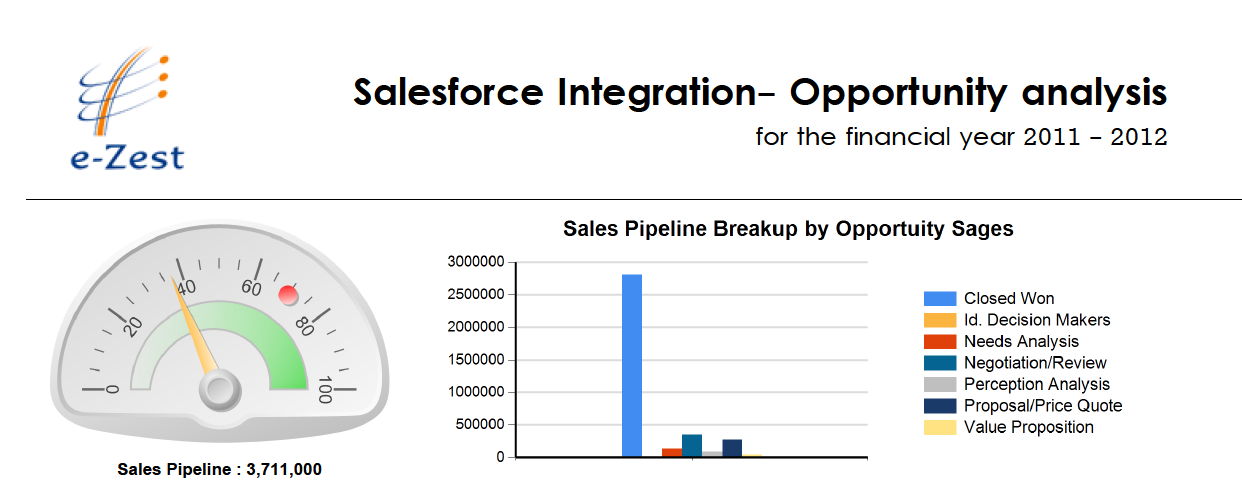
The SalesForce data analysis allows business decision makers in identifying the profile of leads and their success rates in qualifying those leads. The Sales Analysis is helpful in designing and improving the management of lead pipeline.
The detailed analytical reports and dashboards provide the information on:
This Financial Dashboard for your accounting software that gives a holistic view of your business. Dashboard provides overall picture of your actual accounting data and allow you to effectively manage your financial data. Collaboration especially useful for Chartered Accountants, allows you to keep a track of your discussions on timeline. This SaaS product includes user management, multiple company management and also payment integration. Stunning visualizations are achieved using Fusion Charts and embedded Pentaho Open Source BI tool in backend.
SaaS Based Solution for Investor Relations Management provides strong foundation for optimal investor relationship management.
The single interface allows you to analyze the data and also collaborate with investors. The solutions can help support your business, improve team workflow, and help your firm build closer, value-adding relationships with clients.
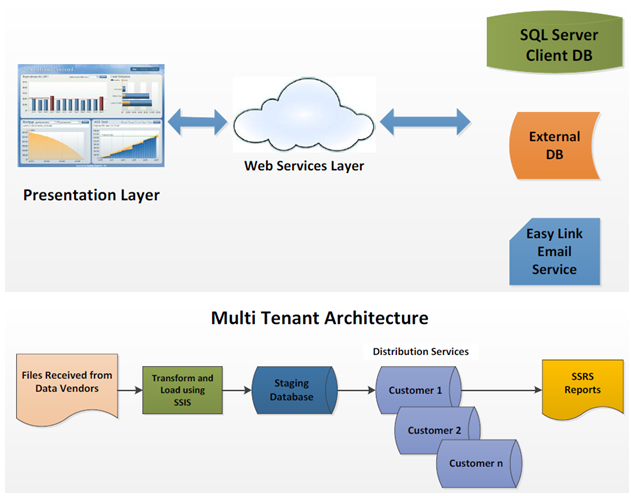
Built using Microsoft BI suite, the application takes data feed from leading financial data provider FactSet Research Systems and allows you to track and analyze your existing shareholder base
Designed and developed BI portal for Survey Application that allows you to do interactive reporting.
It measures different KPIs related to Cost of Turnover and Employee Satisfaction. Trend Analysis allows you to identify trends from surveys answers.
User can customize dashboard by adding charts of their choice and can also change application look & feel. With Chart Builder Component, you can slice and dice your data and can also build your custom chart. Action oriented reporting allows you to take actions when participant raises concerns during survey. With report publisher option, you can configure and receive reports in your inbox.
Chart Builder component allows you to add ad-hoc reporting capabilities in your application. User can now do multidimensional reporting and can create their customize chart. Chart Library allows you to pick from the different chart types that are available. You can export charts in PDF, excel and CSV format. By mapping individual customer dimensions to global dimensions, we did comparative analysis for different customers
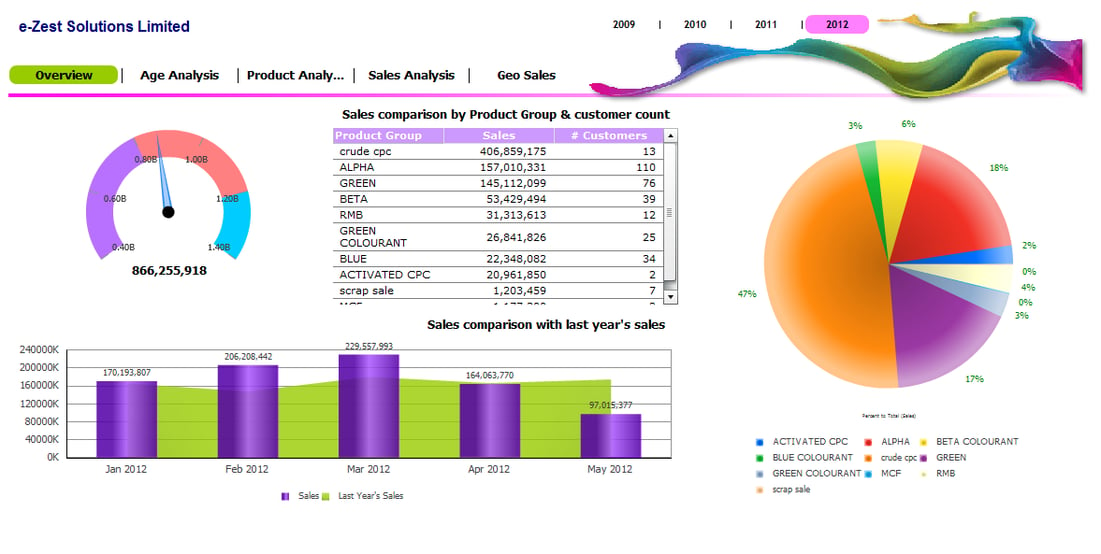
Features:
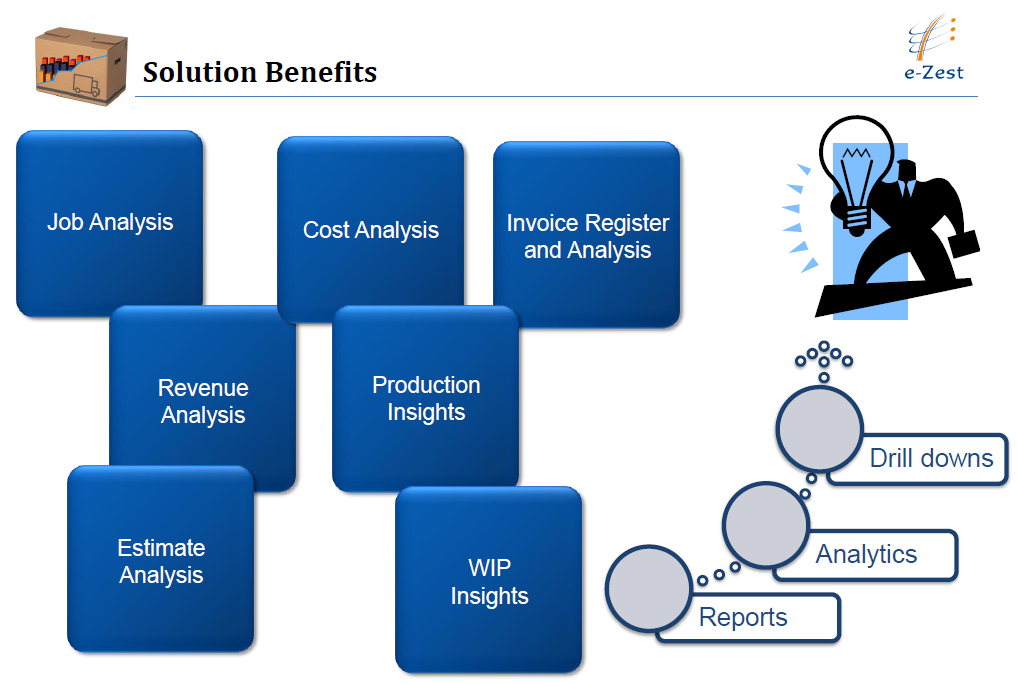
Users can quickly and easily perform multi-dimensional analysis of their organizations such as:
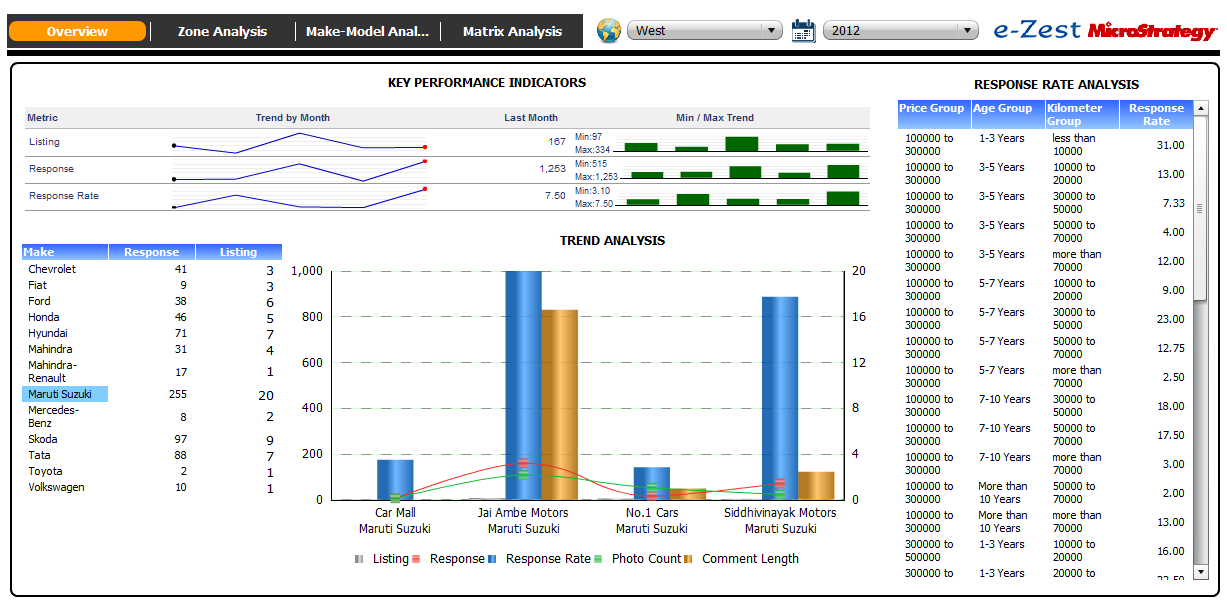
This Dashboard built using, MicroStrategy; is to measure automobile dealer performance. Trend Analysis allows you to measure dealer’s performance and can help in suggesting improvement areas. Zonal and Make/Model Analysis allows you to identify your strong and weak areas.
e-Zest is a leading digital innovation partner for enterprises and technology companies that utilizes emerging technologies for creating engaging customers experiences. Being a customer-focused and technology-driven company, it always helps clients in crafting holistic business value for their software development efforts. It offers software development and consulting services for cloud computing, enterprise mobility, big data and analytics, user experience and digital commerce.